
TL;DR:
- Real-world fuel economy is often lower than EPA ratings because laboratory tests cannot replicate driving conditions, weather, or vehicle loads. Driving habits, environmental factors, and vehicle maintenance significantly influence actual mileage, which typically falls 10–20% below sticker estimates. Tracking actual fuel consumption through manual calculations provides a more accurate understanding of real costs than dashboard displays.
EPA fuel economy ratings are standardized benchmarks, not personal mileage guarantees. The gap between the number on a window sticker and what you actually pump at the gas station exists because laboratory testing cannot replicate the full range of conditions you drive through every day. Understanding why fuel economy ratings differ in real-world use helps you set realistic expectations, budget more accurately, and make smarter car-buying decisions. 16% of drivers consistently get worse fuel economy than EPA estimates, and the reasons go well beyond simple bad luck.
What factors cause real-world fuel economy to differ from EPA ratings?
EPA ratings are produced under fixed laboratory conditions. The agency runs vehicles on a dynamometer, a machine that simulates road resistance, using standardized speed cycles that do not reflect how most people actually drive. EPA ratings serve as comparative baselines, not precise predictions for any individual driver. Discrepancies greater than 10% in city driving or 7% on the highway can trigger retesting, which shows the agency acknowledges real variation exists.
Several variables pull your actual fuel economy away from the rated number:
- Speed and aerodynamic drag. Air resistance increases exponentially with speed. Driving faster forces the engine to work much harder just to maintain pace.
- Driving behavior. Hard acceleration and late braking burn significantly more fuel than smooth, steady inputs.
- Environmental conditions. Cold temperatures, high elevation, and headwinds all reduce engine efficiency and increase fuel demand.
- Vehicle load. Extra passengers, cargo, or a roof rack add weight and drag that the EPA test never accounts for.
- Tire pressure. Underinflated tires increase rolling resistance, which directly raises fuel consumption.
- Accessory use. Air conditioning, heated seats, and rear defrosters add electrical load that the engine must supply.
Each factor alone creates a small gap. Combined, they can push your real-world fuel economy well below the sticker number.
Pro Tip: Check your tire pressure monthly. A tire that is just 5 PSI low increases rolling resistance enough to noticeably reduce your fuel economy over time.

How do driving habits specifically impact your fuel economy?
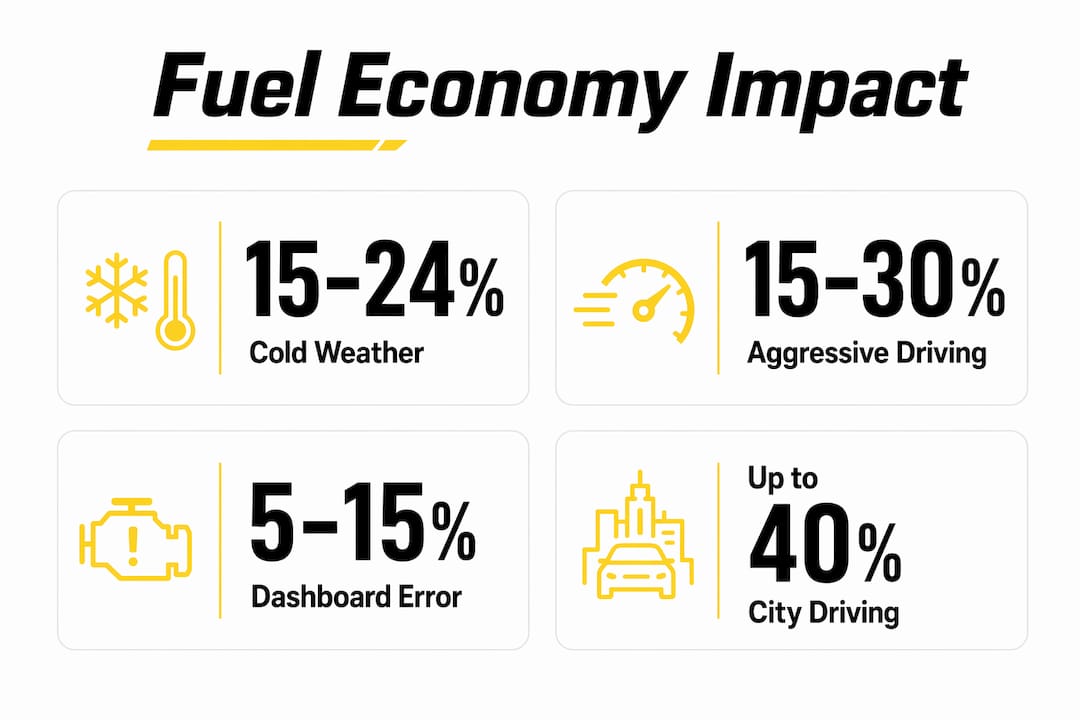
Driving behavior is the single largest variable most drivers can actually control. Aggressive driving causes 15–30% fuel economy loss on highways and up to 40% in city driving. That means a car rated at 30 MPG could deliver as little as 18 MPG in stop-and-go traffic driven aggressively. The math matters when you are budgeting for fuel costs over a year.
Here are the four driving habits with the biggest impact on fuel efficiency:
- Accelerate gradually. Flooring the throttle from a stop forces the engine into a fuel-rich state. Smooth acceleration from 0 to 30 mph uses a fraction of the fuel that a hard launch does.
- Anticipate stops. Coasting toward a red light instead of braking hard at the last second recovers kinetic energy and avoids the fuel cost of re-accelerating from zero.
- Maintain steady highway speeds. Fuel efficiency drops 7–14% for every 5 mph driven over 60 mph. Cruise control on flat highways keeps speed consistent and cuts unnecessary throttle inputs.
- Use Eco mode selectively. Smooth acceleration and braking save more fuel than most automated Eco driving modes. Technology assists, but your foot on the pedal matters more.
Stop/start systems, which shut the engine off at red lights, do save measurable fuel in heavy city traffic. Their benefit shrinks on roads with few stops, so context determines their value.
Pro Tip: On the highway, set cruise control and stay in the right lane. Constant speed changes from weaving through traffic can cost you several MPG over a long trip.
Why do environmental and vehicle-specific factors cause discrepancies in fuel economy?
Temperature is one of the most underestimated factors in fuel consumption differences. Cold weather reduces fuel efficiency by 15–24% at 20°F compared to a warm day. Cold engine oil is thicker and creates more internal friction. Gasoline blends used in winter have slightly lower energy content. The cabin heater draws heat from the engine before it reaches operating temperature, extending the warm-up period where fuel economy is worst.
Electrical accessory loads create a second, less visible gap. Alternator inefficiency under electrical loads significantly increases actual fuel consumption relative to EPA test conditions, where such loads are minimal. Running the air conditioner on a hot day can reduce fuel economy by a meaningful margin, yet the EPA test does not fully replicate peak accessory demand.
Vehicle maintenance plays a role, but not always where drivers expect:
- Oxygen sensors. A degraded oxygen sensor causes the engine to run a richer fuel mixture than necessary, directly increasing consumption.
- Fuel injectors. Dirty or worn injectors deliver fuel unevenly, reducing combustion efficiency.
- Air filters. Modern vehicle air filter replacement has minimal effect on fuel economy in fuel-injected engines. The engine control module compensates automatically. Oxygen sensor and injector condition matter far more.
Short trips compound all of these issues. A cold engine running for only 5 minutes never reaches optimal operating temperature, so every mile of that trip burns more fuel per mile than the EPA rating assumes.
| Factor | Typical fuel economy impact |
|---|---|
| Cold weather (20°F) | 15–24% reduction |
| Aggressive city driving | Up to 40% reduction |
| Highway speeds over 60 mph | 7–14% loss per 5 mph increase |
| Air conditioning use | Noticeable reduction in city driving |
| Degraded oxygen sensor | Measurable increase in fuel consumption |
How accurate are onboard fuel economy displays compared to manual calculations?
Dashboard MPG readouts feel authoritative, but they carry a built-in optimism problem. Dashboard MPG displays often overestimate fuel economy by 5–15% due to sensor and calculation assumptions baked into the engine control module. That overestimate compounds the gap between what you think you are getting and what you are actually burning.
The core issue is how the display calculates consumption. Fuel economy displays rely on assumptions about ideal air-to-fuel ratios and fail to capture transient rich-burn states during hard acceleration and cold starts. The computer assumes the engine is running at its calibrated ideal. Reality is messier.
Short trips make the problem worse. A cold-start commute of 3 miles shows a terrible MPG reading for the first minute, then the display averages upward as the engine warms. By the time you park, the number looks reasonable. But the fuel burned during that cold start was real, and it skews your true average downward in ways the display smooths over.
Manual tracking remains the most reliable method. Fill your tank completely, reset your trip odometer, drive normally, then fill up again. Divide the miles driven by the gallons added. That number reflects your actual fuel consumption with no assumptions. Do this across several fill-ups and you get a true picture of your real-world fuel efficiency.
Pro Tip: Track your fill-ups in a free app like GasBuddy or a simple spreadsheet. After five or six tanks, you will have a reliable baseline that no dashboard display can match.
Key takeaways
Real-world fuel economy falls short of EPA ratings because laboratory testing cannot replicate driving behavior, weather, vehicle load, and accessory use that define everyday driving.
| Point | Details |
|---|---|
| EPA ratings are baselines | Use them to compare vehicles, not to predict your exact fuel costs. |
| Driving behavior is the biggest lever | Aggressive driving cuts city MPG by up to 40%; smooth inputs recover most of that loss. |
| Cold weather hits hard | Fuel economy drops 15–24% at 20°F due to engine friction, fluid behavior, and fuel blend changes. |
| Dashboard displays overestimate | Onboard MPG readouts can be 5–15% optimistic; manual fill-up tracking gives the true number. |
| Maintenance priorities matter | Focus on oxygen sensors and injectors, not air filters, for real fuel economy gains. |
The sticker number is a starting point, not a promise
I have tested enough vehicles over the years to stop being surprised when real-world numbers miss the EPA estimate. What does still surprise me is how many buyers treat the window sticker MPG as a budget line item without any adjustment.
The most useful shift in thinking is treating EPA ratings the way you treat tire speed ratings. They tell you something real and comparable about the vehicle, but they do not describe your specific conditions. A driver in Minneapolis in january, running the heat full blast on a 10-minute commute, will never see the same number as a driver in Phoenix cruising a flat highway at 58 mph.
Long-term fuel consumption tracking is the only method that gives you an honest picture of what a vehicle costs to run. Lab cycles cannot mimic all real-world conditions, and that is not a flaw in the system. It is just a limit of what standardized testing can do. The gap between the sticker and your pump receipt is not the EPA lying to you. It is the distance between a controlled test and your actual life.
The practical takeaway is this: budget for 10–15% less than the rated MPG when estimating fuel costs for a new vehicle. If you drive aggressively, live somewhere cold, or make lots of short trips, budget for 20% less. Then track your actual consumption for a month. You will know exactly where you stand, and you will stop guessing at the pump.
Frenzycars has the fuel economy context you need
Fuel economy is one piece of a larger picture when you are researching a vehicle. Frenzycars covers the full range of efficiency questions, from EV battery lifespan and real-world range to the cost factors that affect what you actually pay to own a car. If you are weighing a gas vehicle against an electric one, the EV range anxiety data on Frenzycars shows how far people actually drive, which puts both fuel economy ratings and electric range figures in honest perspective. For deeper car research across every segment, Frenzycars gives you the expert analysis to make a confident decision.