
TL;DR:
- Long-term vehicle reliability measures how well a car operates with minimal problems over years of ownership and is best assessed by PP100 scores. Gas-powered vehicles are the most dependable long-term option, with lower problem rates than hybrids and electric vehicles, which face more software and technology issues. Brand reputation alone is not enough; buyers should compare models using PP100, projected lifespan, maintenance records, and powertrain type for the most reliable outcome.
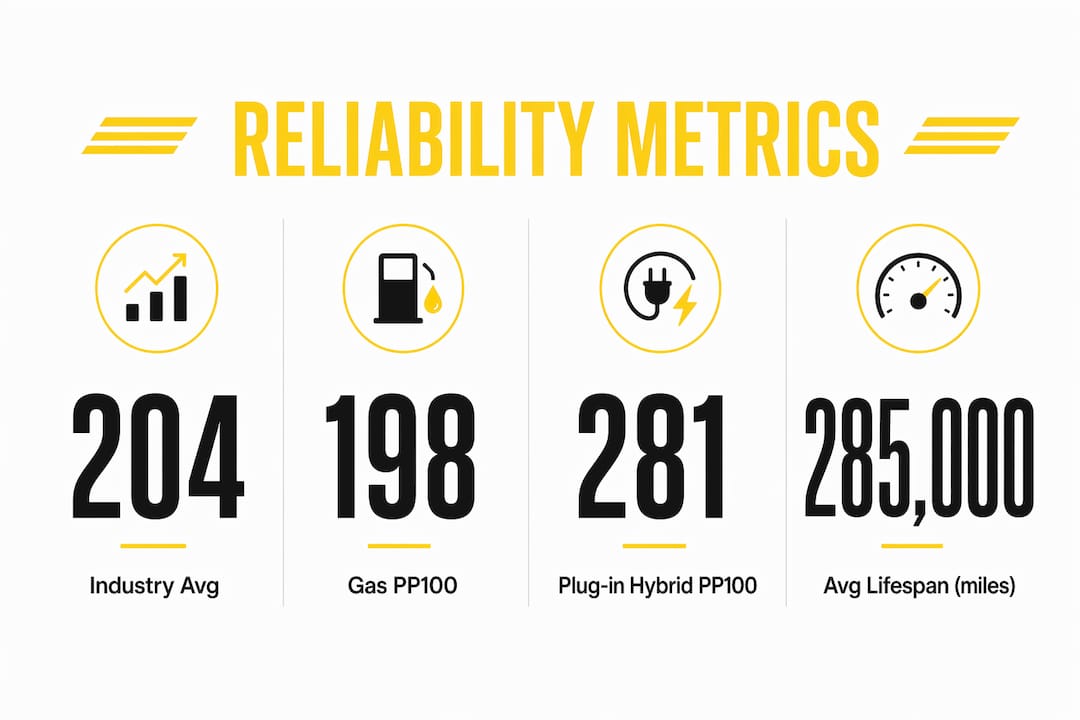
Long-term vehicle reliability is defined as a car’s ability to operate with minimal problems over years of ownership, measured by the PP100 standard (problems per 100 vehicles) and projected lifespan in miles and years. The 2026 J.D. Power U.S. Vehicle Dependability Study sets the industry average at 204 PP100 after three years of ownership. When you compare long term reliability cars, that single number tells you more than any marketing claim ever will. Frenzycars breaks down exactly what that data means and how to use it to buy smarter.
What metrics should you use to compare long-term car reliability?
Vehicle dependability studies measure how many problems owners report per 100 vehicles after three years of real-world use. A lower PP100 score means fewer problems. The industry average of 204 PP100 is your baseline. Any model scoring well below that number is performing above average for long-term dependability.
Lifespan in miles is the second major metric. The average new car lasts roughly 11 years, but top-tier models significantly exceed that. The Honda Civic projects to 13.5 years with an annual service cost of $2,058, compared to the vehicle average of $4,251 per year. That gap in annual cost compounds dramatically over a decade of ownership.
Software reliability is now a third pillar of dependability measurement. Infotainment glitches and OTA update failures rank among the top reported owner issues in 2026. A car with a flawless engine but a buggy infotainment system still scores poorly on modern dependability studies.
Key metrics at a glance
| Metric | What it measures | Why it matters |
|---|---|---|
| PP100 score | Problems per 100 vehicles after 3 years | Lower score = fewer owner-reported issues |
| Projected lifespan | Expected miles or years before major failure | Directly affects total cost of ownership |
| Annual service cost | Average yearly maintenance and repair spend | Reveals real ownership affordability |
| Software reliability | Infotainment, OTA, and connectivity issues | Growing share of all reported problems |
When comparing specific models, stack these four metrics side by side. A car that scores well on all four is a genuinely dependable long-term investment.
How does powertrain type affect vehicle long-term reliability?
Powertrain choice is the single biggest variable in long-term reliability comparisons. The 2026 J.D. Power data shows clear separation across fuel types:
- Gas-powered vehicles: 198 PP100, the lowest problem rate of any powertrain type
- Hybrid vehicles: 213 PP100, slightly above the industry average
- Battery electric vehicles (BEVs): 237 PP100, driven largely by software and charging system issues
- Plug-in hybrids (PHEVs): 281 PP100, the highest problem rate of any category
Plug-in hybrids carry two complete powertrains, a gas engine and an electric motor, plus a large battery pack. That mechanical complexity directly multiplies the number of things that can fail. PHEVs report 281 PP100, which is 38% above the industry average. Buyers who prioritize long-term dependability over fuel economy should weigh that tradeoff carefully.
Electric vehicles face a different challenge. Battery degradation and software instability account for the majority of BEV problems. If you are considering an EV, understanding EV battery lifespan in real-world conditions is as important as the PP100 score.
Pro Tip: If you want the lowest problem rate and the longest projected lifespan, a gas-powered vehicle from a top-tier brand remains the statistically safest choice in 2026. Hybrids offer a reasonable middle ground if fuel savings are a priority.
Which car brands statistically offer the best long-term reliability?
Brand engineering philosophy is the strongest predictor of long-term reliability. Brands that use conservative engineering with long model cycles consistently lead dependability rankings. Toyota and Lexus are the clearest examples. They avoid frequent tech overhauls that introduce new failure points, and their reliability scores reflect that discipline.

Lifespan data reinforces the brand tier picture. Toyota averages 285,000 miles, Honda 270,000 miles, and Mazda 260,000 miles. Choosing one of these brands increases your likelihood of reaching 200,000 miles by over 40% compared to the average vehicle. That translates to 2–4 additional years of service life.
Brand reliability tiers by projected lifespan
| Tier | Brands | Avg. projected lifespan | Reliability profile |
|---|---|---|---|
| Top tier | Toyota, Honda, Mazda | 260,000–285,000 miles | Conservative engineering, low PP100 |
| Mid tier | Nissan, Subaru, Kia | 200,000–240,000 miles | Solid dependability, some model variation |
| Lower tier | Premium luxury brands | Below industry average PP100 | High feature complexity raises failure risk |
Premium vehicles average 217 PP100, compared to 198 PP100 for mainstream brands. That 19-point gap exists because premium vehicles pack in more complex technology. More features mean more things to report as problems. A luxury badge does not guarantee long-term dependability.
Specific models worth noting include the Honda Civic, Toyota Corolla, and Mazda3. All three rank among the top cost-effective reliable cars in 2026 studies, combining low PP100 scores with strong projected lifespans and below-average service costs.
Pro Tip: When comparing brands, check model-level data, not just brand averages. Even top-tier brands have individual models that underperform. A brand’s average lifespan is a starting point, not a guarantee.
What role does maintenance history play in long-term reliability?
Maintenance history is the most underrated factor in any vehicle reliability comparison. A well-documented service record minimizes mechanical failure risks regardless of what the brand’s average reliability rating says. Neglected routine care is directly linked to the most common long-term ownership failures, including engine damage, transmission wear, and cooling system breakdowns.
“Maintenance history verification is the best predictor of realized long-term reliability for used vehicles. A complete service record can mitigate risks otherwise inferred from brand or model averages.”
When evaluating a used car, the service record tells you whether the previous owner actually realized the model’s reliability potential. A Toyota with no oil change records is a worse bet than a mid-tier brand with a spotless service history.
Here is what to look for in a used vehicle’s maintenance records:
- Oil change intervals: Should align with manufacturer recommendations, typically every 5,000–10,000 miles
- Timing belt or chain service: Missed intervals are a leading cause of catastrophic engine failure
- Brake fluid and coolant flushes: Often skipped but critical for long-term system health
- Transmission service: Especially important for vehicles with over 100,000 miles
- Recall completion records: Confirms the vehicle received manufacturer safety and reliability fixes
A car that checks all five boxes is a far safer long-term purchase than one with a strong brand name but gaps in its service history. Always request a full maintenance log and cross-reference it with a vehicle history report.
How can buyers practically compare long-term reliability?
A structured approach to vehicle reliability comparison removes guesswork and keeps emotion out of the decision. Follow these steps before committing to any purchase:
- Pull the PP100 score for the specific model and model year using J.D. Power’s Vehicle Dependability Study. Compare it against the 204 PP100 industry average.
- Check projected lifespan in miles for the model. Anything projecting above 250,000 miles puts you in top-tier territory.
- Calculate total ownership cost by multiplying the annual service cost estimate by your expected years of ownership. The Honda Civic’s $2,058 annual cost versus the $4,251 vehicle average saves over $22,000 across a decade.
- Identify the powertrain type and factor in its category PP100 score. Gas vehicles average 198 PP100; PHEVs average 281 PP100.
- Verify maintenance history for any used vehicle. A complete service record is non-negotiable.
- Check software reliability for the specific model year. Infotainment and connectivity problems now represent a significant share of all reported issues.
Common pitfalls to avoid
| Pitfall | Why it misleads | Better approach |
|---|---|---|
| Relying on brand reputation alone | Brand averages mask model-level variation | Always check model-specific PP100 data |
| Ignoring powertrain type | PHEVs score 38% above average PP100 | Compare within the same powertrain category |
| Skipping software reliability | Tech issues now drive a major share of problems | Check infotainment scores separately |
| Overlooking maintenance history | A neglected reliable brand can still fail early | Require full service documentation |
Pro Tip: Use resale value as a secondary reliability signal. Vehicles that hold their trade-in value tend to be models with strong reliability reputations, because the market prices in dependability over time.
Key takeaways
The most effective way to compare long-term car reliability is to combine PP100 scores, projected lifespan data, powertrain type, and verified maintenance history into a single evaluation framework.
| Point | Details |
|---|---|
| Use PP100 as your baseline | The 2026 industry average is 204 PP100; lower scores mean fewer owner-reported problems. |
| Powertrain type changes everything | Gas vehicles average 198 PP100; PHEVs average 281 PP100, the highest of any category. |
| Top-tier brands last significantly longer | Toyota, Honda, and Mazda project 260,000–285,000 miles, well above the average vehicle lifespan. |
| Maintenance history predicts used-car reliability | A complete service record reduces failure risk more reliably than brand reputation alone. |
| Software reliability is now a core metric | Infotainment and OTA issues drive a growing share of all reported dependability problems. |
Why I think most buyers compare reliability the wrong way
Most car buyers check a brand’s overall reputation and stop there. That approach misses the most important details. I have seen buyers choose a premium luxury model expecting top-tier dependability, only to discover that premium vehicles average 217 PP100 versus 198 PP100 for mainstream brands. The badge costs more and breaks more often.
The insight that changed how I evaluate cars is this: conservative engineering correlates directly with longer vehicle life. Brands that resist adding every new technology feature to every model year tend to produce vehicles that simply keep running. Toyota did not become the reliability benchmark by chasing trends. It got there by refining proven systems over long model cycles.
Software reliability is the factor most buyers still ignore completely. A car with a flawless mechanical record but a buggy infotainment system will frustrate you daily and score poorly on dependability studies. As vehicles add more connected features, software stability is becoming as important as engine durability.
My honest recommendation: weight the PP100 score, the projected lifespan, and the maintenance record equally. Do not let a strong brand name substitute for model-level data. And if you are buying used, a complete service history is worth more than any reliability award the model ever won.